Schema Editor
What Is the Schema Editor?
The schema editor is the tool you use to customize which metrics appear on a goal’s dashboard. While NeoCash auto-generates a sensible default schema for each goal, you may want to add metrics the AI did not include, remove ones that are not relevant, or adjust metric types and descriptions. The schema editor gives you full control over your dashboard’s structure.
Think of the schema as a blueprint. It defines the list of metrics your dashboard will display — their names, their types, and their descriptions. The actual values of those metrics come from your conversations, but the schema determines what slots are available to be filled.
Accessing the Schema Editor
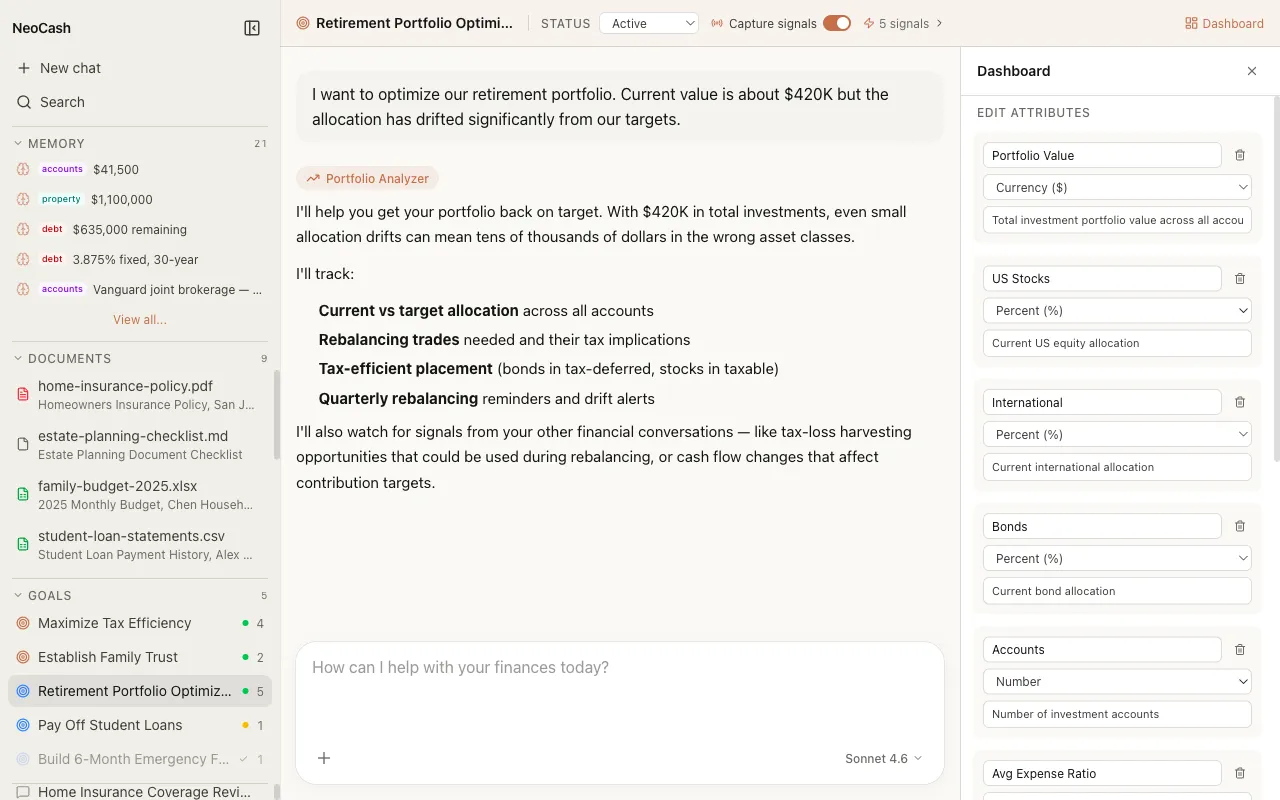
To open the schema editor, navigate to the goal whose dashboard you want to customize. In the dashboard panel, look for the edit or settings control near the top of the metrics section. Clicking it opens the schema editor view where you can see and modify the full list of metrics defined for this dashboard.
The schema editor presents your metrics as an editable list. Each entry shows the metric name, its type, and a description field. You can add new entries, remove existing ones, or modify any field.
Defining Custom Metrics
Each metric in your schema has three properties that you define.
Name
The metric name is the label that appears on your dashboard. Choose something clear and concise that immediately communicates what the metric tracks. Good names are specific to your goal context.
Good names: Current Balance, Monthly Savings Rate, Target Retirement Age, Debt-to-Income Ratio
Less helpful names: Amount, Rate, Number, Status
The name should be self-explanatory. Someone glancing at your dashboard should understand what each metric represents without needing additional context.
Type
The metric type determines how values are formatted and displayed. Choose from the five available types:
| Type | Display Format | Best For |
|---|---|---|
| currency | $1,234.56 | Dollar amounts, balances, payments, contributions |
| percentage | 23.7% | Rates, progress, allocations, ratios |
| number | 742 | Counts, scores, durations, plain quantities |
| date | March 15, 2028 | Deadlines, milestones, target dates, review dates |
| text | On Track | Statuses, categories, qualitative assessments |
Choosing the correct type matters because it affects readability. A savings balance displayed as “14200” is harder to parse than “$14,200.00.” A progress value displayed as “0.237” is less intuitive than “23.7%.”
Description
The description is a short explanation of what the metric measures and where its data comes from. Descriptions serve two purposes: they help you remember what each metric is for, and they help the AI understand how to populate the metric from conversation.
Example descriptions:
- “Total amount currently saved in the dedicated home down payment account”
- “Percentage of monthly take-home pay directed to savings and investments”
- “Target date for having the full emergency fund amount saved”
- “Current qualitative assessment of goal progress: On Track, Behind, or Ahead”
A well-written description improves the accuracy of automatic metric population. The AI uses the description to match conversational data points to the correct metric, so being specific pays off.
Auto-Generation via the API
When you create a new goal, NeoCash can generate a complete dashboard schema automatically. This happens through the /api/generate-dashboard-schema endpoint, which sends your goal context to Claude and receives back a structured schema tailored to your specific objective.
How Auto-Generation Works
The auto-generation process analyzes several pieces of context:
- Goal title and description — The name and summary you provided when creating the goal.
- Conversation history — The messages exchanged so far in the goal thread.
- Goal category — Whether this is a savings goal, debt payoff, investment, retirement plan, or another category.
Claude processes this context and returns a schema containing metrics that are appropriate for your goal type and specific situation. A retirement planning goal gets metrics like Target Retirement Age, Current Portfolio Value, Annual Contribution, and Expected Monthly Income. A debt payoff goal gets metrics like Outstanding Balance, Interest Rate, Monthly Payment, and Payoff Date.
When Auto-Generation Triggers
Schema auto-generation typically occurs when:
- You create a new goal and have an initial conversation about it
- You explicitly request a dashboard for a goal that does not have one yet
- The AI determines it has enough context to build a meaningful schema
The generated schema is a starting point. You are always free to modify it afterward using the schema editor.
Editing Schemas After Creation
Dashboards are not locked in once created. You can return to the schema editor at any time to make changes.
Adding New Metrics
As your goal evolves, you may want to track additional data points. Click the add button in the schema editor to create a new metric entry. Define its name, type, and description, then save. The new metric appears on your dashboard immediately, ready to be populated from your next conversation.
Common reasons to add metrics:
- Your financial situation has become more complex
- You started tracking a new aspect of your goal (like tax implications)
- The auto-generated schema missed something important to you
Removing Metrics
If a metric is no longer relevant, you can remove it from the schema. This cleans up your dashboard and keeps the focus on what matters. Removing a metric does not delete historical data — it simply hides that metric from the active dashboard view.
Modifying Existing Metrics
You can change a metric’s name, type, or description at any time. This is useful when:
- You want a clearer label for an existing metric
- A metric’s type was set incorrectly (for example, a percentage stored as a number)
- You want to update the description to help the AI populate it more accurately
Changes to the schema take effect immediately. The dashboard re-renders with your updated metric definitions, and the AI uses the new descriptions for future metric extraction from conversations.
Schema Design Tips
Start With Auto-Generation
Let the AI generate your initial schema, then customize from there. The auto-generated schemas are usually a solid starting point that covers the most important metrics for your goal type.
Keep Descriptions Specific
Vague descriptions lead to inaccurate metric population. Instead of “The amount,” write “Total balance across all savings accounts dedicated to this goal, excluding checking account float.”
Use the Right Types
Resist the temptation to store everything as text. Properly typed metrics enable better formatting, progress tracking, and trend analysis. If a value is a dollar amount, use currency. If it is a rate, use percentage.
Five to Ten Metrics Is the Sweet Spot
Too few metrics and your dashboard does not tell you much. Too many and it becomes overwhelming. Most goals are well-served by five to ten carefully chosen metrics that cover the essential dimensions of your progress.
Next Steps
- Review the full Metrics type reference.
- See how Action Items complement your custom metrics.
- Return to the Dashboard Overview for the complete picture.