Dashboard Overview
What Are Dashboards?
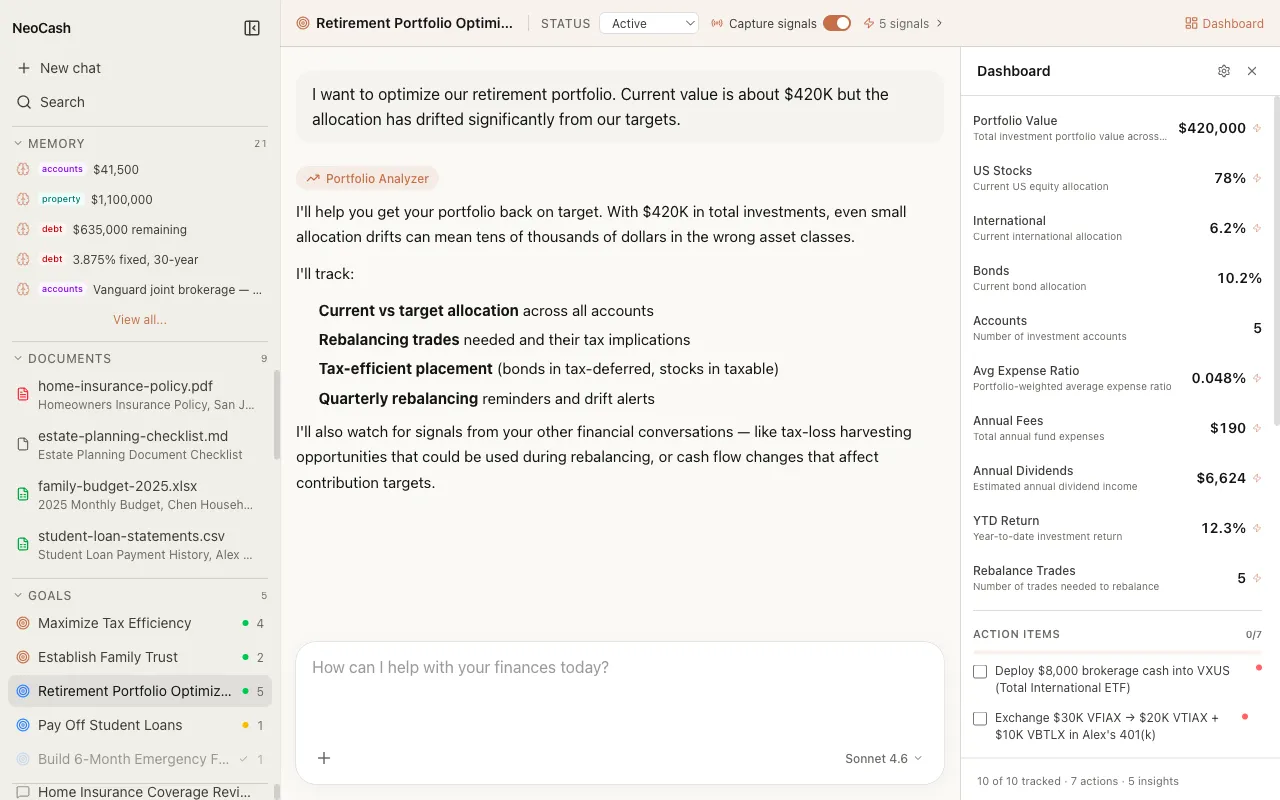
Every financial goal in NeoCash gets its own dedicated dashboard. A dashboard is a structured, at-a-glance view of where you stand on a specific goal — whether that is saving for a home, paying down debt, or building an emergency fund. Instead of scrolling through past conversations to recall key numbers, you open the dashboard and see everything organized in one place.
Dashboards are not static forms you fill out manually. They are living documents that evolve as you chat with NeoCash about your goals. The AI extracts relevant data points from your conversations and populates the dashboard automatically, so the information stays current without extra effort on your part.
One Dashboard Per Goal
Each goal you create in NeoCash receives its own independent dashboard. This means your retirement planning dashboard tracks entirely different metrics than your student loan payoff dashboard. The separation keeps things focused: you see only the numbers and action items that matter for the goal you are currently reviewing.
When you navigate to a goal thread and open its dashboard, you are looking at a self-contained snapshot of that specific financial objective. There is no single monolithic dashboard trying to cram every aspect of your finances into one screen.
The Three Components
Every dashboard is built from three core components that work together to give you a complete picture of your progress.
Metrics
Metrics are the quantitative backbone of your dashboard. They are typed data points — things like your current savings balance, target amount, monthly contribution rate, or projected completion date. Each metric has a defined type (currency, percentage, number, date, or text) that determines how it is displayed and formatted.
For example, a “Home Down Payment” goal might track metrics such as:
- Current Savings (currency) — $14,200
- Target Amount (currency) — $60,000
- Progress (percentage) — 23.7%
- Monthly Contribution (currency) — $850
- Target Date (date) — March 2028
- Status (text) — On Track
Metrics update as you discuss your goal with NeoCash. When you mention a raise that lets you increase your monthly savings, the AI updates the relevant metric values in your dashboard.
Action Items
Action items are concrete next steps that the AI generates based on your conversations. They represent things you should do to advance your goal — tasks like “Open a high-yield savings account,” “Review your employer 401(k) match,” or “Set up automatic bi-weekly transfers.” Each action item can be marked as complete, giving you a satisfying sense of forward momentum.
Action items keep your financial planning grounded in practical steps rather than abstract numbers alone.
Insights
Insights are contextual observations that the AI surfaces about your goal. Unlike metrics (which are data points) and action items (which are tasks), insights are analytical takeaways — things like “Your savings rate has increased 15% over the past three months” or “At your current pace, you will reach your target six months ahead of schedule.” Insights help you understand the story behind the numbers.
How Dashboards Auto-Generate
You do not need to design your dashboard from scratch. When you create a new goal and start chatting about it, NeoCash uses Claude to analyze the context of your goal and automatically generate an appropriate dashboard schema. The AI selects metrics that make sense for your specific objective, assigns the correct types, and provides meaningful descriptions.
For instance, if you tell NeoCash you want to save for a vacation, the auto-generated dashboard might include metrics for total trip budget, amount saved so far, savings percentage, departure date, and booking status. If you are working on paying off credit card debt, the generated schema would instead focus on outstanding balance, interest rate, monthly payment amount, and payoff date.
This auto-generation happens behind the scenes when the AI has enough context about your goal. You can always customize the resulting schema later using the schema editor if the default layout does not perfectly match your needs.
Viewing Your Dashboard
To view a dashboard, navigate to any goal thread and look for the dashboard panel. The dashboard appears alongside your conversation, so you can reference your metrics and action items while continuing to chat. On wider screens, the dashboard sits in a side panel. On narrower screens, you can toggle between the conversation view and the dashboard view.
The dashboard updates in real time as you chat. If you mention a new savings milestone or complete an action item during a conversation, you will see the dashboard reflect those changes immediately.
Dashboard Examples by Goal Type
Different types of financial goals produce different dashboards. Here are a few examples to illustrate how the auto-generation adapts to your context:
Savings Goal
A savings goal dashboard typically includes metrics for current balance, target amount, monthly contribution, progress percentage, and target date. Action items might include setting up automatic transfers, shopping for high-yield savings accounts, or reviewing your budget for additional savings opportunities.
Debt Payoff Goal
A debt payoff dashboard focuses on outstanding balance, interest rate, minimum payment, actual monthly payment, payoff date, and total interest paid. Action items often include exploring balance transfer options, calling to negotiate a lower rate, or setting up autopay to avoid late fees.
Investment Goal
An investment-focused dashboard tracks portfolio value, annual contribution, asset allocation, rate of return, and rebalancing dates. Action items might involve reviewing your allocation, maxing out tax-advantaged accounts, or researching low-cost index fund options.
Retirement Planning Goal
Retirement dashboards include metrics like target retirement age, current portfolio value, expected monthly income in retirement, Social Security estimate, and savings gap. These dashboards tend to have longer time horizons, so the insights component is especially valuable for keeping you motivated over decades of progress.
Privacy and Local Storage
Like everything in NeoCash, your dashboard data stays on your machine. Metrics, action items, and insights are all stored locally in IndexedDB within your browser. The only network requests involved are the AI API calls that analyze your conversation to extract and update dashboard information. No dashboard data is ever sent to a remote server or shared with third parties.
Next Steps
- Learn about the different Metrics types and how they track your progress.
- Understand how Action Items keep your goals moving forward.
- Explore the Schema Editor to customize your dashboard layout.